Please note that this section should be read in conjunction with our Terms of Use. Q·CAPITAL AG does not offer a systematic investment approach. Its strategy is not based upon risk diversification principles, but rather upon acting in an entirely opportunistic manner. The net asset value of Q·CAPITAL does not correlate with major indices.
INVESTMENT PERFORMANCE
Monthly Performance in (%) net of fees in EUR
| Jan | Feb | Mar | Apr | May | Jun | Jul | Aug | Sep | Oct | Nov | Dec | YTD (%) | CUM (%) | |
|---|---|---|---|---|---|---|---|---|---|---|---|---|---|---|
| 2002 | 2.3 | 1.2 | 5.2 | 0.8 | -1.3 | -9.2 | -1.4 | -3.2 | -3.6 | 5.1 | 7.5 | -2.1 | 0.3 | 0.3 |
| 2003 | -3.5 | -2.8 | 0.3 | 2.9 | 9.1 | 4.2 | 0.9 | 1.4 | -0.5 | 1.5 | -0.4 | 2.6 | 16.3 | 16.6 |
| 2004 | 2.8 | 1.4 | 1.2 | 0.0 | 0.2 | 1.1 | 0.4 | -0.3 | 2.8 | 0.6 | 0.5 | 1.8 | 13.1 | 31.9 |
| 2005 | 2.3 | 4.7 | 1.0 | 0.5 | 2.4 | 2.6 | 4.5 | 9.7 | 1.5 | -2.6 | 3.2 | 2.0 | 36.3 | 79.7 |
| 2006 | 2.4 | 1.4 | 8.3 | 0.6 | -3.0 | -0.5 | 2.7 | 1.7 | 0.6 | 4.4 | 35.4 | 0.1 | 62.2 | 191.5 |
| 2007 | 6.1 | -1.8 | 1.0 | 0.6 | -0.2 | 4.6 | -0.2 | 0.0 | 0.3 | 7.5 | 2.6 | 1.1 | 23.2 | 259.0 |
| 2008 | -2.1 | 1.5 | -2.2 | 2.6 | 3.1 | -2.4 | -3.4 | -0.8 | -6.9 | -11.4 | -4.0 | -3.2 | -26.2 | 164.8 |
| 2009 | 1.5 | -0.8 | 0.2 | 0.0 | 8.5 | -0.9 | 1.8 | 4.2 | 5.0 | 1.4 | 2.6 | 1.8 | 27.8 | 238.3 |
| 2010 | 4.0 | -1.7 | 4.9 | 0.3 | -3.7 | 1.0 | 1.6 | 1.4 | 3.0 | 3.1 | -1.1 | 10.0 | 24.7 | 321.8 |
| 2011 | -0.6 | -0.9 | -1.1 | 1.3 | -0.3 | 5.9 | -0.1 | -3.3 | -3.2 | 0.4 | -2.2 | -1.5 | -5.9 | 296.7 |
| 2012 | 2.2 | 0.4 | 0.8 | 0.0 | -1.2 | 1.8 | 2.6 | -0.3 | -0.3 | -0.4 | 0.1 | 2.1 | 8.1 | 328.9 |
| 2013 | 1.5 | 0.0 | 0.3 | 0.3 | 0.2 | -1.1 | 1.0 | -0.7 | 1.8 | 2.1 | 1.0 | 0.4 | 7.2 | 359.2 |
| 2014 | -1.1 | 0.8 | -1.2 | 0.5 | 0.9 | 1.7 | 1.1 | 0.5 | -0.6 | -0.9 | 1.3 | 0.1 | 3.2 | 374.1 |
| 2015 | 0.4 | 2.5 | 4.4 | 1.1 | 1.2 | 1.4 | 0.2 | -1.0 | -0.5 | 1.2 | 0.9 | -0.2 | 12.1 | 431.3 |
| 2016 | -2.0 | -0.5 | 1.3 | 0.1 | 0.0 | 1.0 | 0.5 | 0.4 | 0.0 | 0.0 | -0.2 | 6.4 | 6.7 | 468.3 |
| 2017 | -0.3 | 3.8 | 0.1 | 0.7 | 1.1 | 0.4 | 0.4 | -0.3 | -0.1 | 0.7 | 0.1 | 2.2 | 9.2 | 520.7 |
| 2018 | 1.6 | -1.7 | -1.4 | 1.8 | 0.0 | 0.6 | 0.4 | -0.9 | 1.1 | -1.7 | -0.6 | -2.9 | -3.6 | 498.2 |
| 2019 | 1.7 | 0.7 | 0.2 | 1.3 | -0.6 | 6.0 | 0.3 | -0.1 | -0.1 | 0.6 | 0.0 | 2.1 | 12.8 | 574.9 |
| 2020 | 1.2 | -2.6 | -15.4 | 3.8 | 2.6 | 1.4 | 1.4 | 1.8 | -1.3 | -0.9 | 5,1 | 8.6 | 3.6 | 599.4 |
| 2021 | 0.2 | 0.6 | 3.8 | 0.2 | 0.3 | 4.5 | 0.6 | 0.5 | -0.2 | 0,6 | -3.6 | 0.0 | 7.5 | 652.0 |
| 2022 | -2.8 | -3.7 | -0.6 | -0.3 | -0.6 | -0.6 | -1.4 | -0.7 | -0.6 | -0.5 | 0.5 | -1.0 | -11.6 | 564.5 |
| 2023 | 1.4 | -0.5 | -1.6 | -0.2 | 1.3 | 2.6 | 0.1 | -1.2 | -1.0 | -0.7 | 0.7 | 0.2 | 1.0 | 571.5 |
| 2024 | 0.0 | 0.6 | 0,5 | 1.1 | 579.1 |
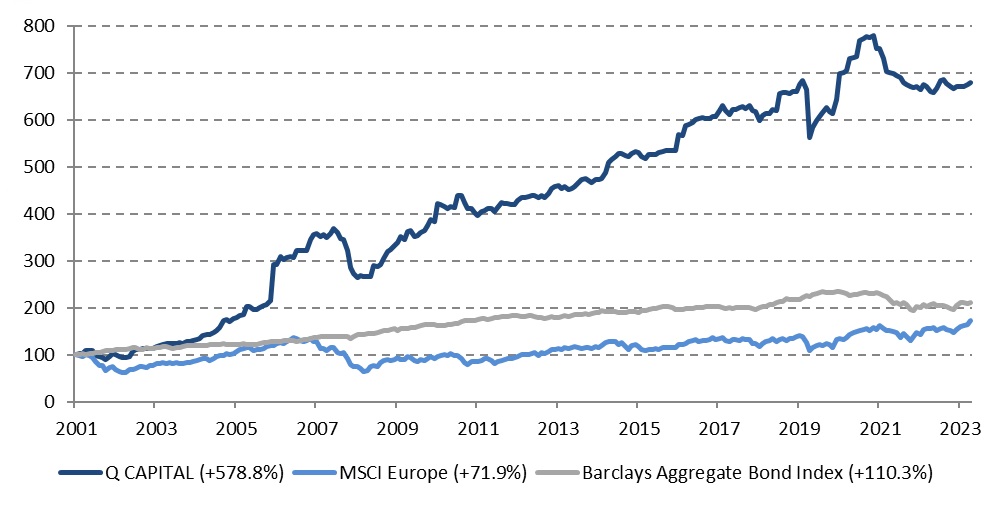
Cumulative Return of EUR 100 invested in Dec 2001